Project Methodology
Overview
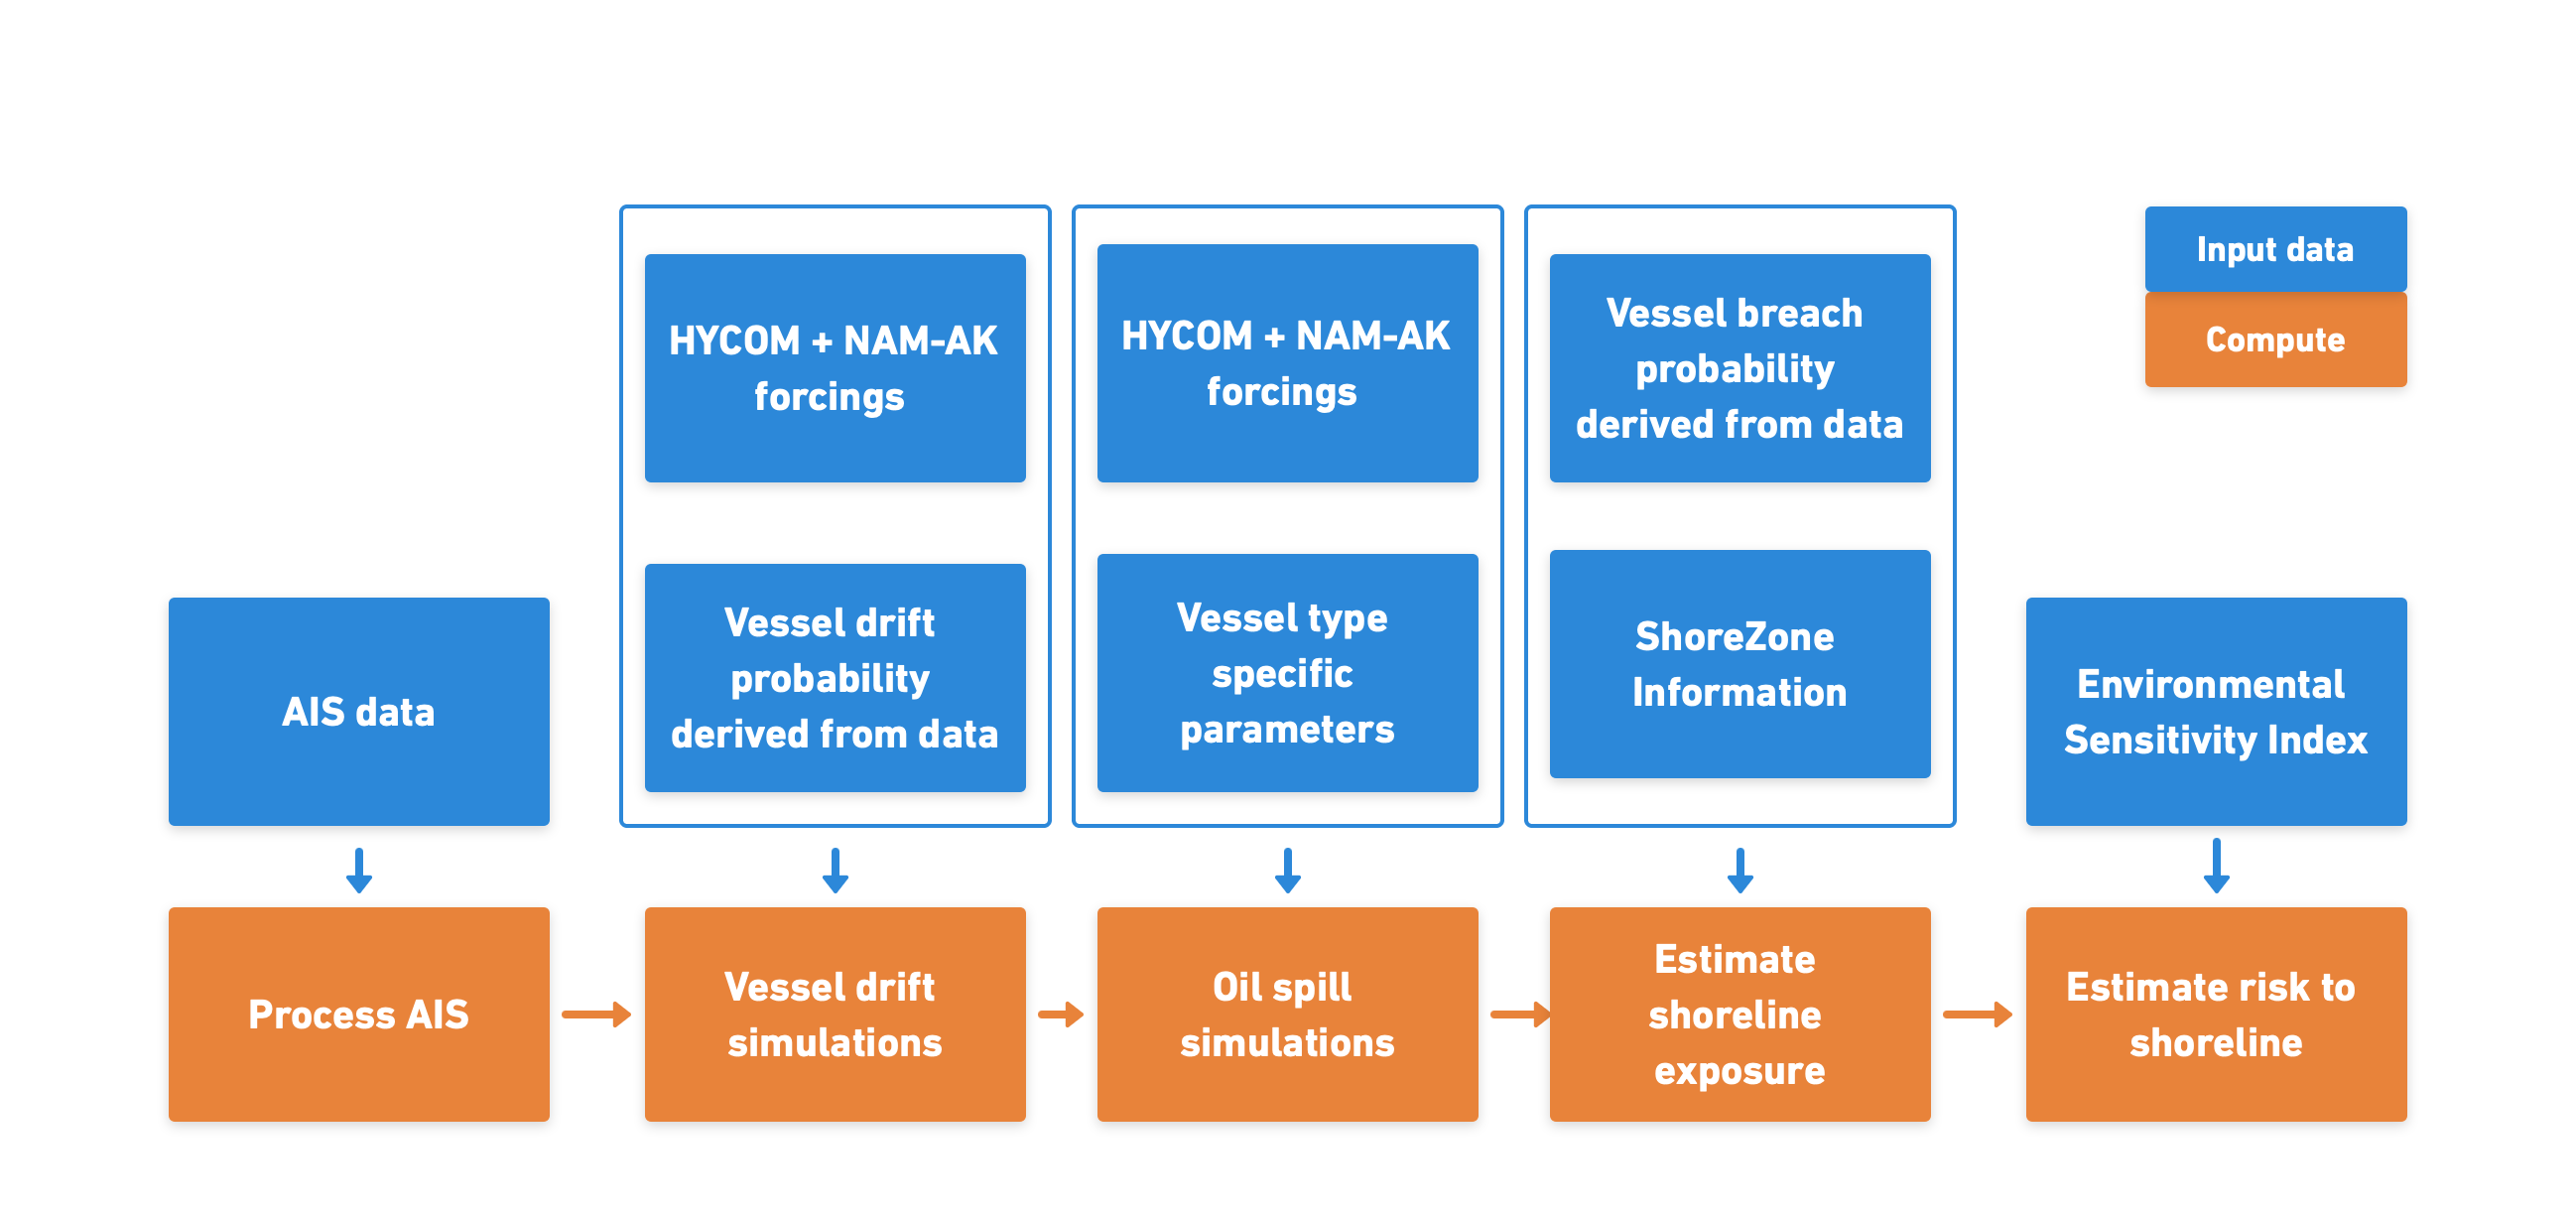
The goal of this project was to better understand the risks of oil spills associated with vessel traffic in the Bering and Chukchi Seas to the Alaskan shoreline. Specifically, the project aimed to estimate the risk of oil spills to environmentally sensitive areas from breached vessels that had lost control, drifted, and run aground. Resulting products from the project include estimates of the likelihood of vessels drifting, drifting vessels running aground, grounded vessels breaching and spilling oil, and the risk posed to coastal areas from such scenarios.
The project combined the best available Automatic Identification System (AIS) data of vessel locations, historical information of drifting vessels and grounded vessels, Lagrangian particle simulations to model hypothetical paths of drifting vessels and the fate of oil spilled from breached vessels, the composition of the coastline from Alaska ShoreZone, and a metric of coastline sensitivity to oils spills from Environmental Sensitivity Index (ESI) maps.
The data and simulations were combined using an Oil Spill Risk Assessment (OSRA) method inspired by Amir-Heidari et al. (2019), Sepp-Neves et al. (2016), Sepp-Neves et al. (2015), Landquist et al. (2013), and Price et al. (2003) that combines a probabilistic estimation of the likelihood of an oil spill occurring, the likelihood that such a spill resulted in the oiling of the coastline, and a measure of coastline sensitivity to oil.
Data products resulting from this work include rasters of vessel count density by vessel type and month derived from AIS data, daily estimates of the likelihood that a vessel will drift in the Bering and Chukchi Seas, and highly resolved maps of the likelihood that a vessel will ground, breach, and spill oil along the coastline represented as measures of hazard (or, exposure) and risk.

Drifting Vessels
The first component of the project assessed the likelihood of a drifting vessel grounding into a coastline segment derived from over thirty five million individual hypothetical drifting vessels simulations. The simulations were parameterized using historical information on vessel traffic derived from AIS data, records of disabled vessels, and numerous studies characterizing the behavior of drifting vessels.
AIS Data
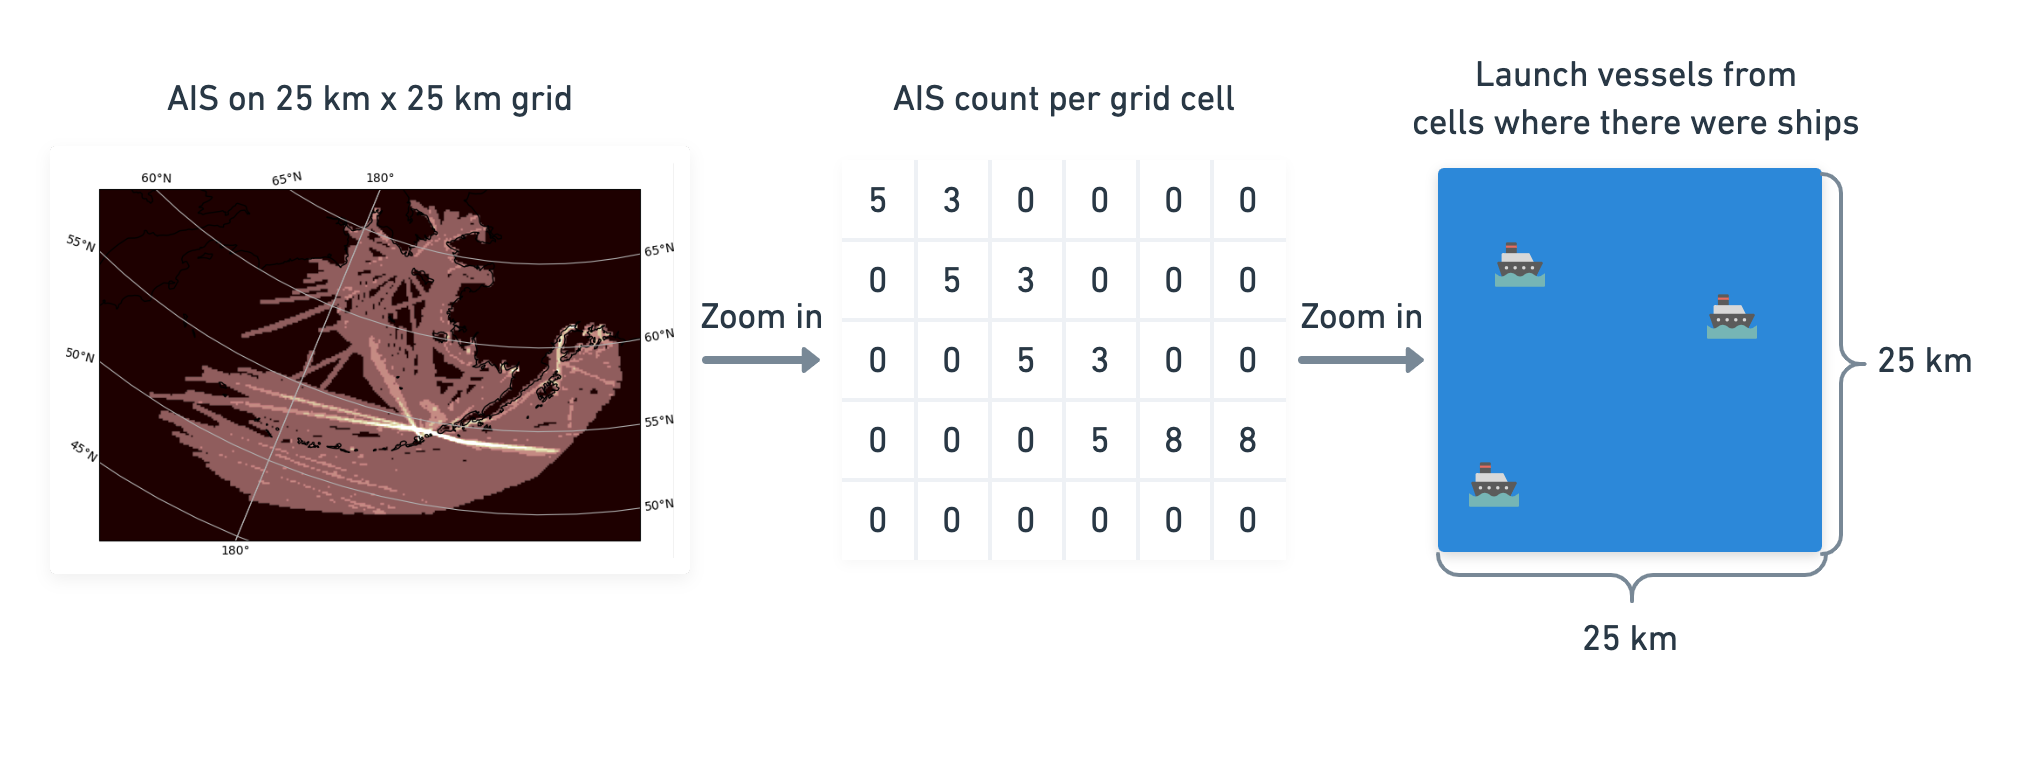
Satellite based AIS data provided locations from which to launch the drifting vessel simulations because of the superior coverage it provides of vessel traffic across the entire Bering and Chukchi Seas including areas along the Russian coast that are not covered by terrestrial based systems.
The raw AIS point data from 2019 was processed and converted into rasterized counts of vessel voyages organized by vessel type (cargo, passenger, tanker, and other) and month at a resolution of 500 x 500 meters. The rasterized vessel counts were then resampled to a square 25 x 25 kilometer grid (Particle Release Grid) from which simulated drifting vessels were launched.

Vessel Drift Simulations
Vessel Drift simulations were performed using the OpenDrift software library using HYCOM for ocean currents and NAM 3 km Alaska for 10 m wind forcings.
The time and location of each vessel drift simulation was informed by the processed AIS data. For each month and vessel type, 1000 hypothetical vessels were released at random locations from each grid cell in the Particle Release Grid where a vessel had traversed for a given month in 2019. Each vessel simulated was parameterized with a random wind scaling (2% - 10%) and offset (-60 to 60 degrees) to capture the range of variability of windages observed for all vessel types in a manner similar to Galt et al. 2015 and others.
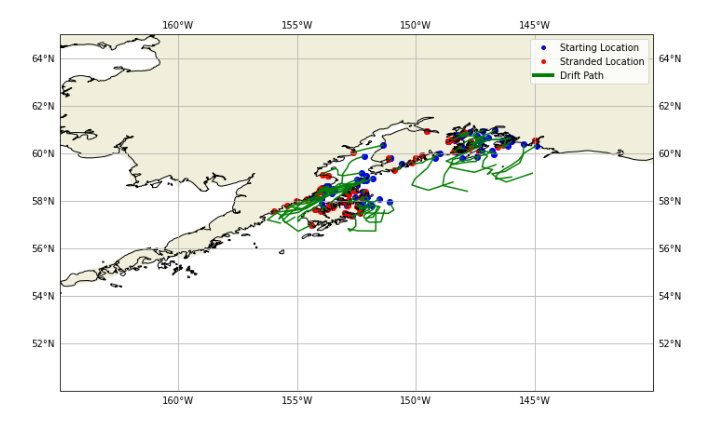
The vessel drift simulations provide tracks that describe possible trajectories of where a vessel may drift and possibly run aground from each position in the Particle Release Grid and, in aggregate, provide the basis for the estimates of the likelihood of a vessel running aground along a coastal segment.

Likelihood of Vessel Grounding
The results of the vessel simulations were used to estimate the hazard posed by vessels grounding into the shore. These estimates were grouped by month, vessel type, and by the individual segments that comprise the [Environmental Sensitivity Index (ESI)](https://response.restoration.noaa.gov/resources/ environmental-sensitivity-index-esi-maps) maps of the region. Specifically, the likelihood of a vessel running aground in a particular ESI segment from Particle Release Grid point is given by:
which combines the probability of a vessel being at location , , the ratio of simulated vessels that ran aground in region to the total amount of simulated vessels, , and the probability that a vessel goes adrift. was then integrated over release points and time to provide estimates of the probability that a vessel would go adrift and ground along ESI segment .
Oil Spills Due to Breached Grounded Vessels
Oil spills were simulated using OpenDrift incorporating the NOAA Office of Response and Restoration oil weathering model Adios.
As was the case with the vessel drift simulations, the oil spill simulations were forced by HYCOM for ocean currents, water temperature, and salinity and NAM 3 km Alaska for winds. Every oil spill simulation was parameterized to use 1000 particles to simulate the release of an amount of marine diesel representative of each vessel type and was subject to weathering via evaporation, dispersion, and emulsification. As was the cast in for the vessel drift simulations, the oil spill simulations were run for a period of seven days.
Oil spill simulations were launched from each of the locations where a vessel grounded in the vessel drift simulations.
The results of the oil spill simulations were then used to generate estimates of the hazard and risk posed by oil spills to the shore.
Estimates of Hazard from Breached Vessels to Coastline
The results of the oil spill simulations were used generate estimates of the hazard posed by oiling from a breached grounded vessel to the coastline. Similarly to the hazard estimate for grounding vessels, the estimate of oil spill hazard to the coastline were grouped by month, vessel type, and by the individual segments that comprise the Environmental Sensitivity Index (ESI) maps of the region. The hazard of oiling coastline segment by a breached vessel run aground is given by:
where is the probability that vessel ran aground at point in ESI segment (the point where a vessel ran around in the vessel drift simulations), is the ratio of simulated spills that stranded on the coast in region , and is the concentration index, the mean concentration of oil stranded in region for each month divided by the maximum oil concentration within the domain. was integrated over stranding points and time to provide monthly estimates of hazard for each ESI segment .
is defined as where , the probability of a spill due to a breached hull, is 0.70 if location is characterized as rocky coast, or 0.54 if it is non-rocky. The values were derived from a combination of data sources including NOAA Incidents and the State of Alaska Response Database.
Estimates of Risk to Coastline from Breached Vessels
Finally, the results from the hazard estimates were combined with Environmental Sensitivity Index (ESI) to estimate risk. The risk to region from a spills is given by:
where is the estimate of oil spill hazard to ESI segment and is the ESI sensitivity index normalized from a range of 1 to 10 to a range of 0.1 to 1.